Unleash the power of your calibration data!
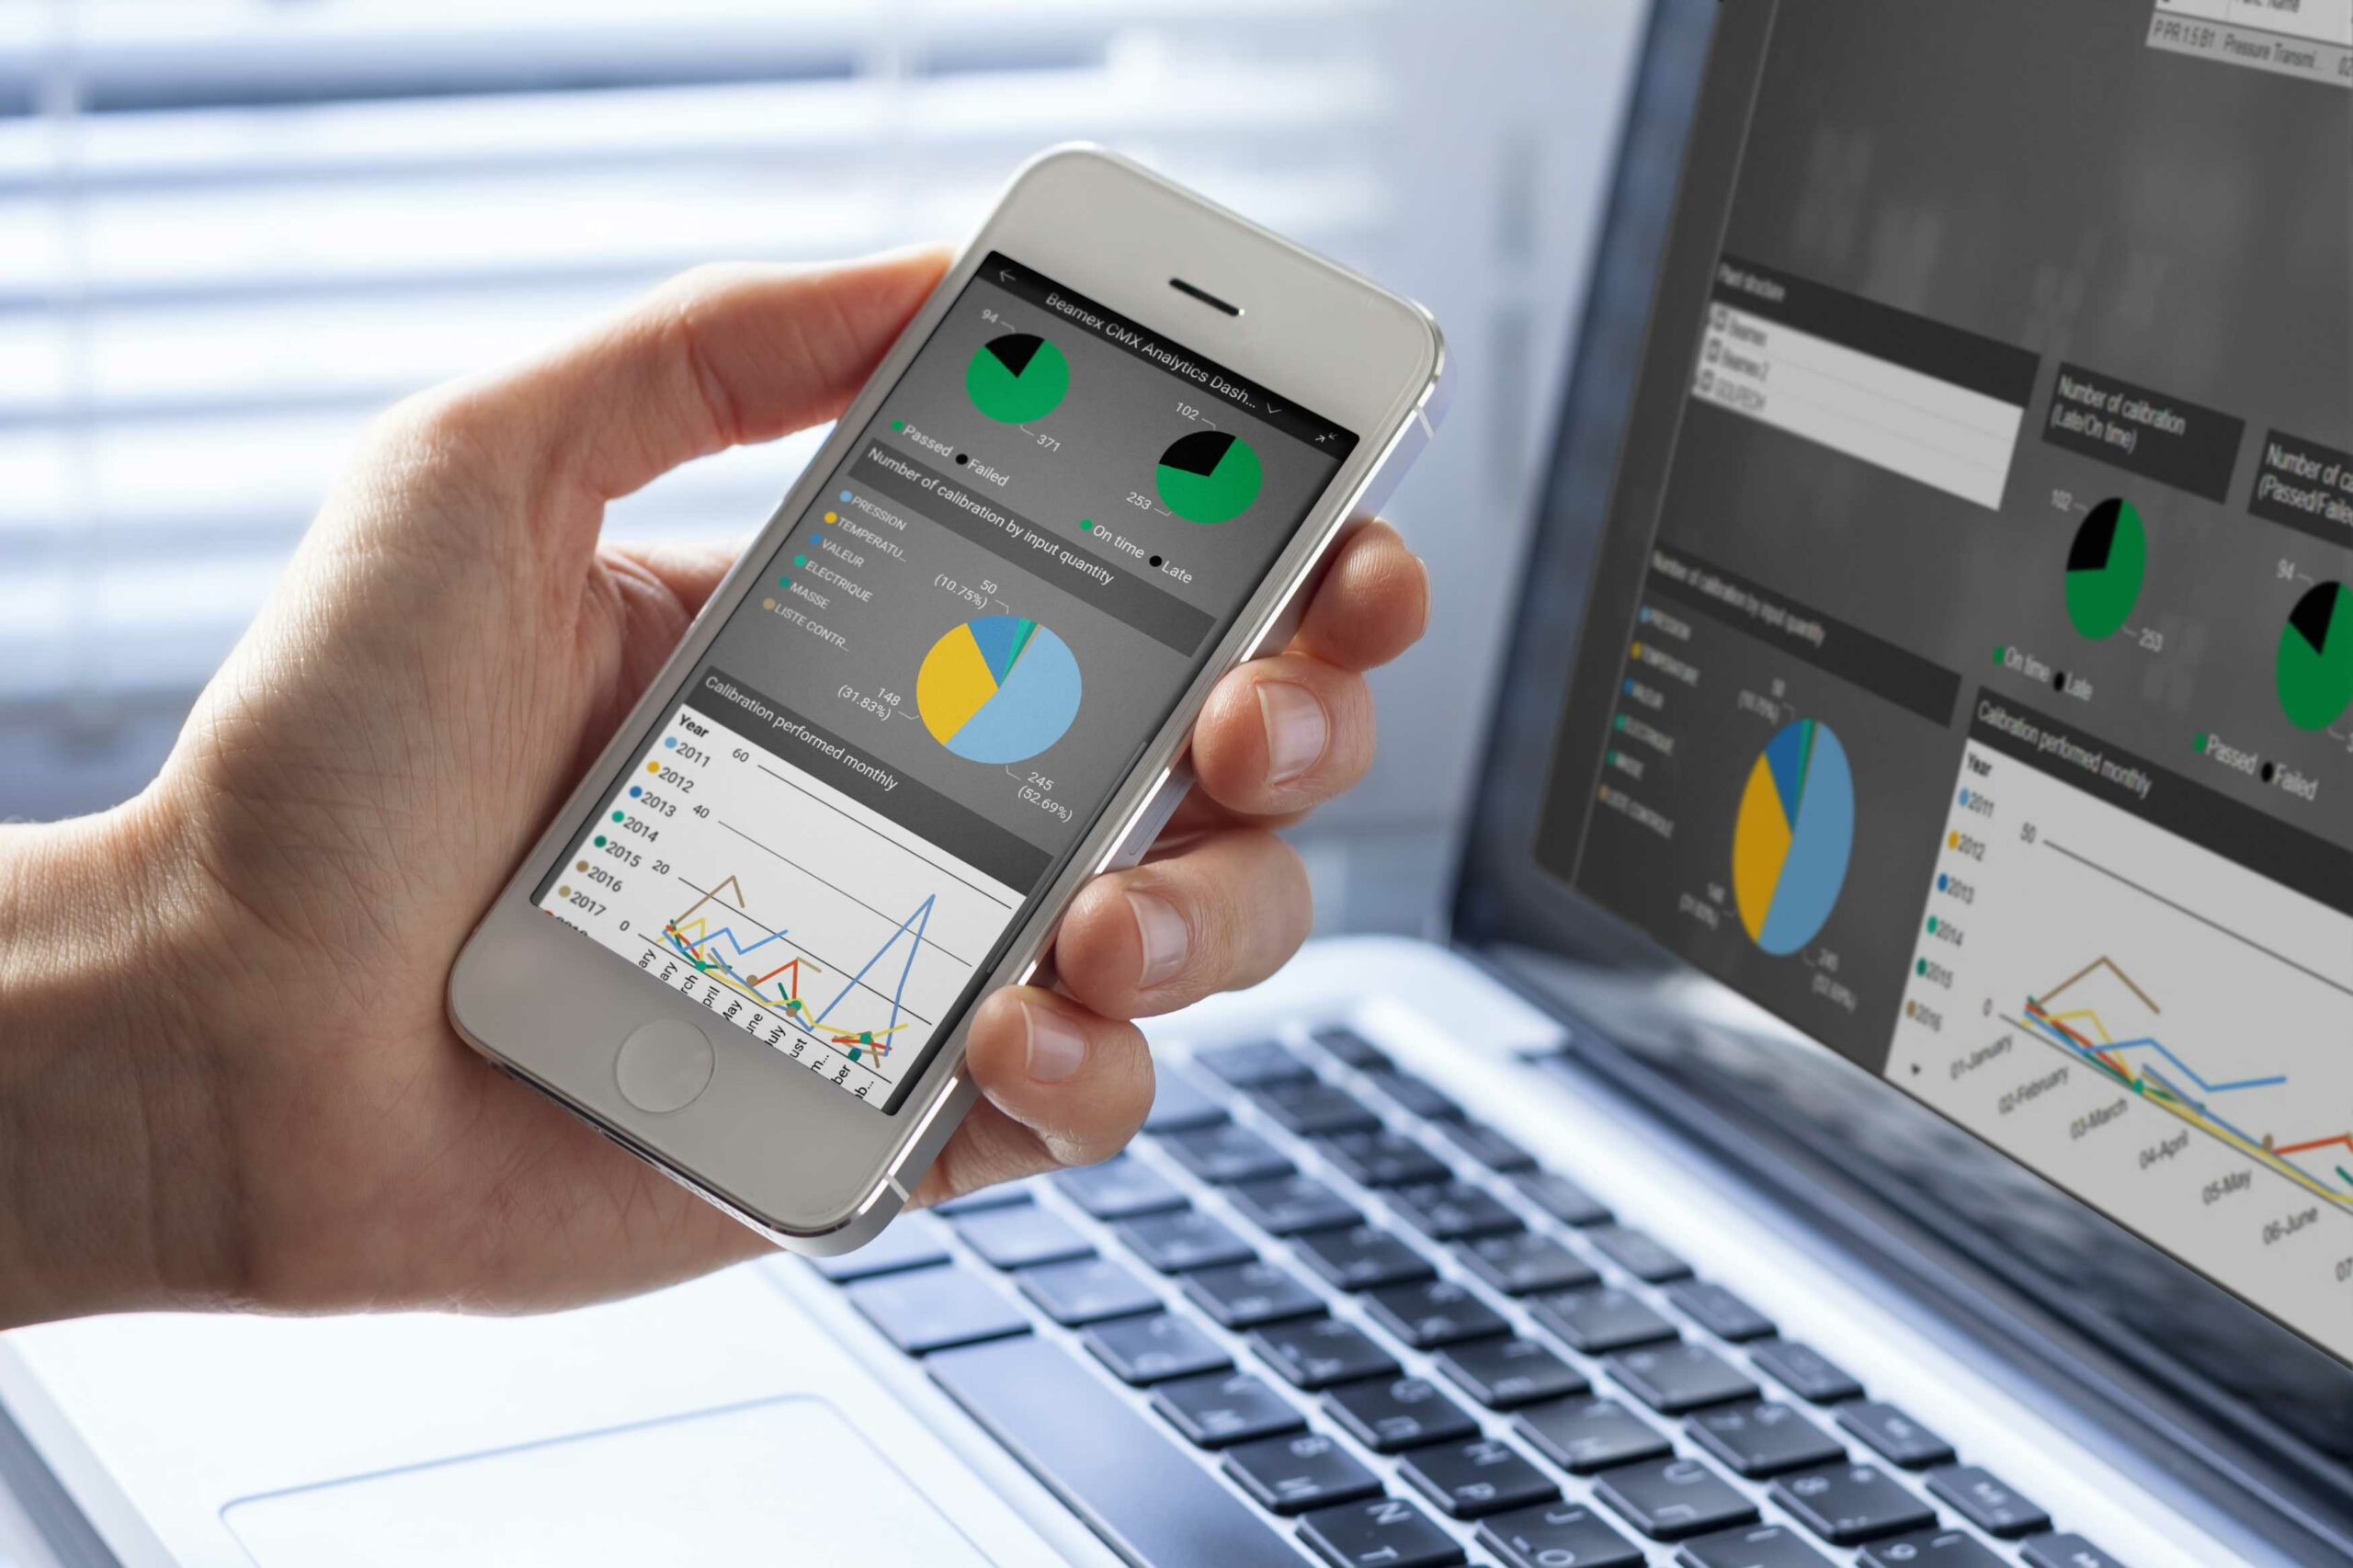
The calibration data in Beamex CMX Calibration Management Software is your company’s most valuable calibration asset. The CMX Analytics Dashboard helps you to get even more value from your calibration data allowing you to optimize your calibration activities and improve productivity.
Visual summary of calibration KPI’s
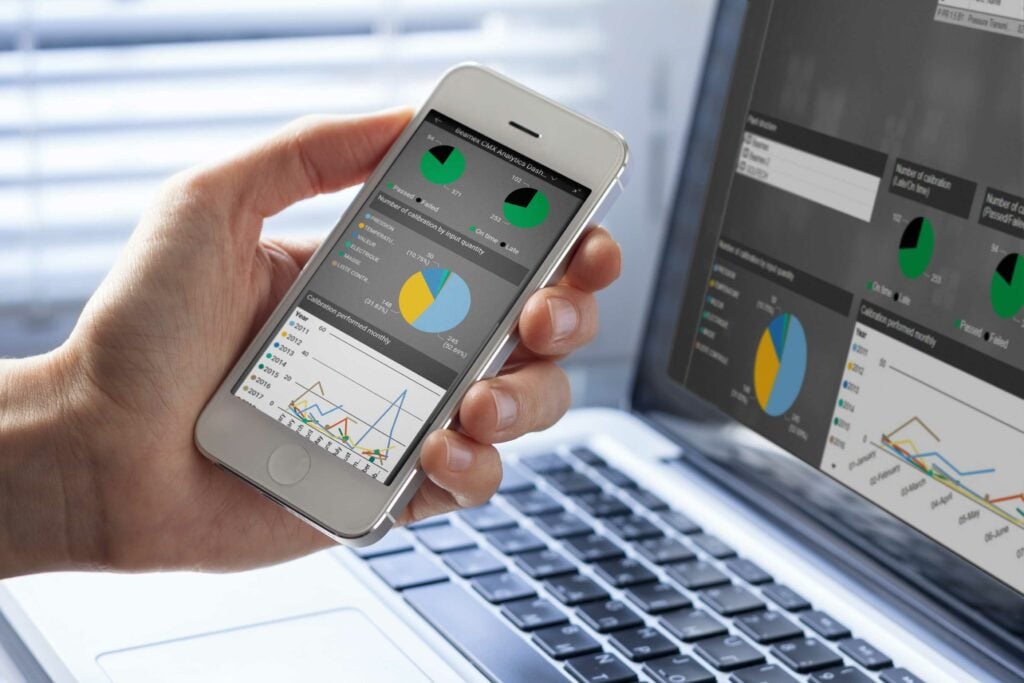
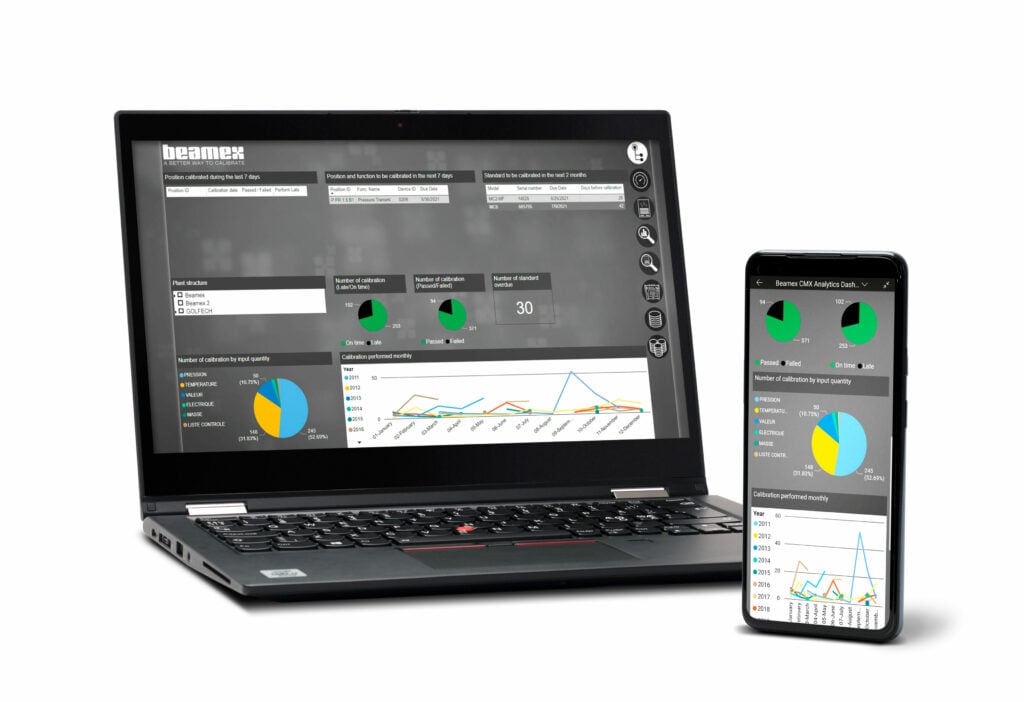
The Beamex CMX Analytics Dashboard provides an easy-to-use visual summary of your key calibration performance indicators such as the percentage of calibrations failed or performed after the due date, reference standards usage, and calibrator reverse traceability.
Overview of your team’s workload
Get an overview of your team’s workload over time to better predict workload during a given month or week – and act accordingly together with technicians to address any issues. This will help you use resources more efficiently, save costs, and improve productivity.
Advanced history trend
Enable preventive maintenance based on the output of the dashboard and see the device manufacturer and model maintenance history over time. With history trending based on device manufacturer or model, you can see if a given sensor type performs better or worse than another model.
Calibration history analysis
Get predictions of drift based on a forecast of the last calibrations performed. If the forecast is good and the trend is well within out-of-tolerance limits. For example, you can extend the calibration interval from 6 to 12 months – saving time and money.
Impact of uncertainty on calibrations
The uncertainty page allows visualizing the impact of uncertainty on calibrations. For example, a calibration point may be passed but when taking the uncertainty in account then there is a risk that it is failed. It also helps you to ensure that your reference standard is accurate enough for the calibration, taking the test uncertainty ratio TUR into account.
Predict the risk of failed calibrations
Analyze the historical behavior of instruments and predict the risk of failed calibrations.
Improve efficiency
Being aware of the workload of your calibration team helps you to utilize the team more efficiently to bring productivity improvements and cost savings.
By analysing the complete work history allows identifying room to improve performance.
With the dashboard it easy to share the calibration data analysis for various stakeholders as the basis for decision making.

Ensure compliance
The CMX Analytics Dashboard helps you ensure that all calibrations are performed on time and no important calibrations are missed. This is especially important if your company does not allow overdue instruments to be used.
You can trace where and when calibrators have been used, which is important if a calibrator is found to have been defective or out of tolerance.
Learn more about Beamex calibration solutions

Calibration management
Discover how Beamex calibration software helps you digitalize and automate calibration processes.
Learn more >
Field calibration
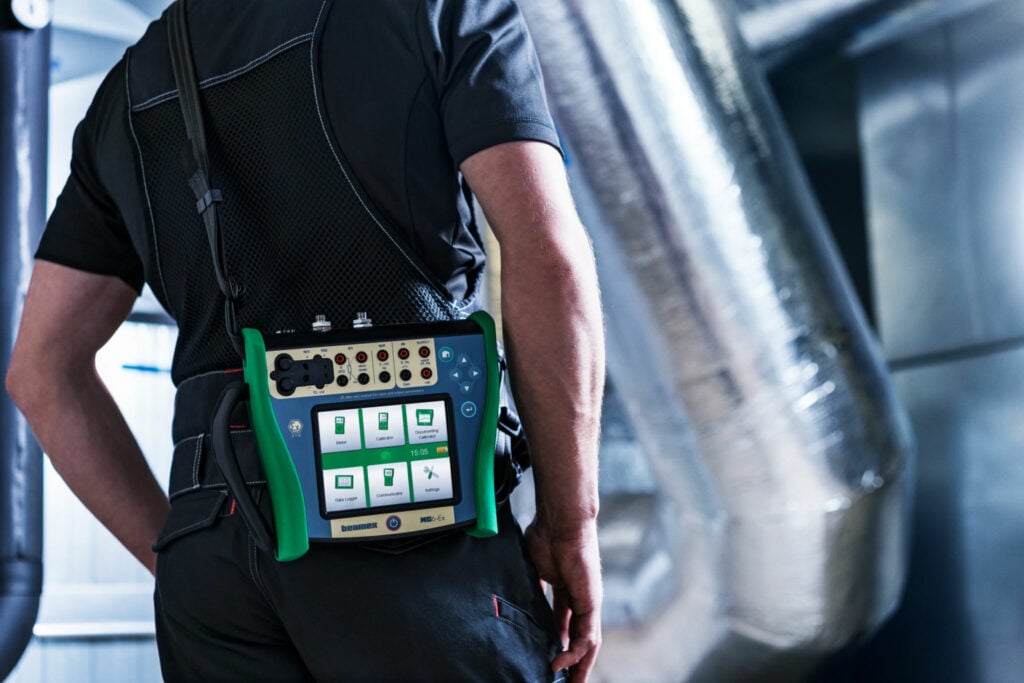
Experience the Beamex portfolio of advanced field calibration technology.
Learn more >
Workshop calibration
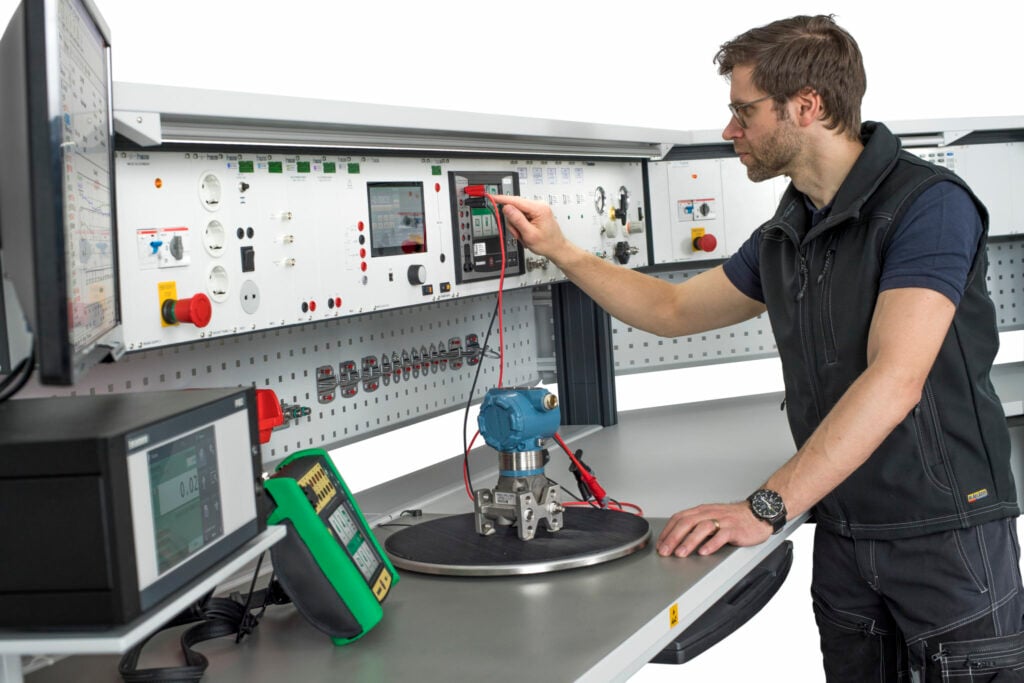
Meet the Beamex range of industrial workshop calibration solutions.
Learn more >

Services
Get the most out of Beamex technology with expert services, and calibration and repair services.
Learn more >
